Method of electrical resistivity tomography (ERT)
Currently the geophysical technique of electrical tomography has become the main method of study of electrical resistivity. Always following the fundamental steps involved in the measurement method, as it was initiated in the standard ASTM D6431 . By directly injecting an electric current I (amps, A) into the ground through a pair of electrodes and measuring the voltage V (volts, V).
Due to recent advances in the development of acquisition systems multiple electrodes and investments 2-D and 3-D electrical resistivity tomography provides images of complex subsurface structures. This is achieved by measurements at different levels of the subsoil using the usual devices, ie: Wenner, Schlumberger, dipole-dipole, pole-dipole, etc.
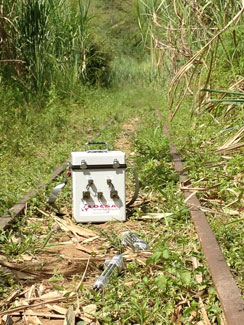
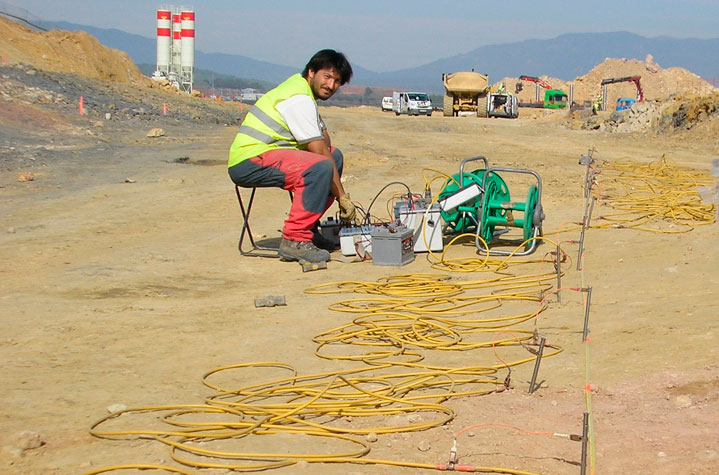
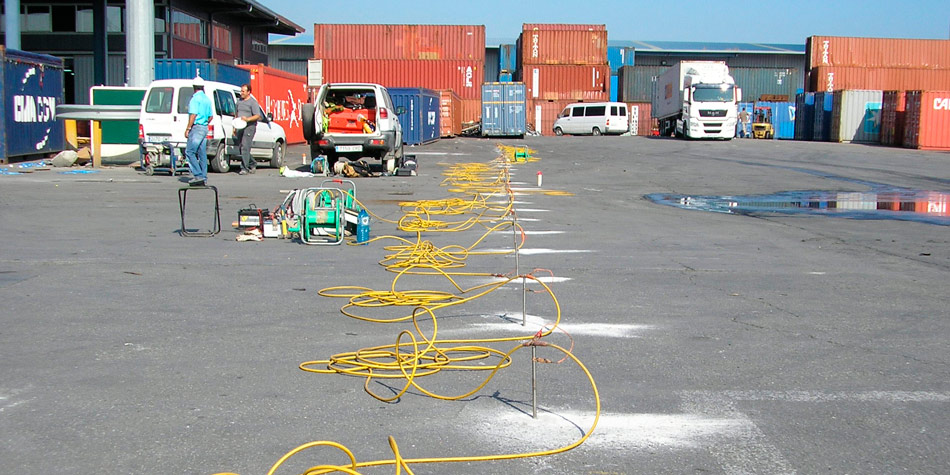
In the geophysical services we offer, we use "multielectrode" field acquisition systems. With which we can obtain these different levels. Making several passes on the same profile, with the same device and different device sizes.
Most common configurations
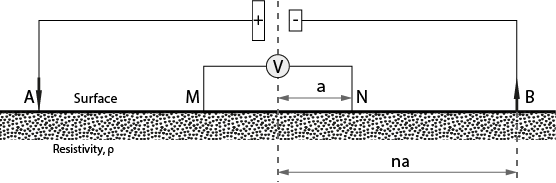
| Schlumberger |
|---|
 |
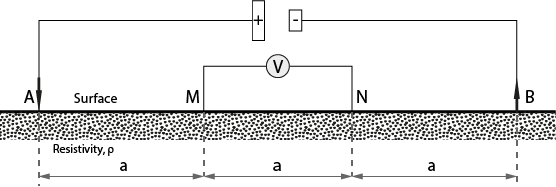
| Wenner |
 |
| Dipole-dipole |
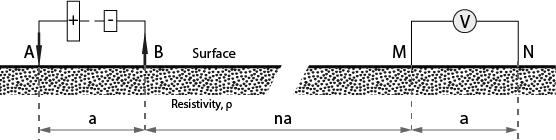 |
| Pole-dipole |
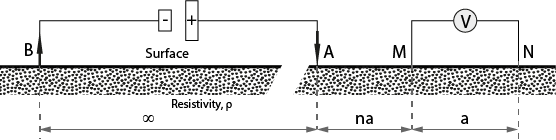 |
Where A and B are current electrodes and M and N are potential electrodes. The constant a is a distance in meters (generally not more than 10 m, except for devices, and therefore, large depths of investigation). The variation of the parameter n we are defining the different levels that we are measuring, since of its value depends the size of the device and therefore the depth to which we arrive. In the pole-dipole device, the current electrode designated as ∞ means that the electrode B is located very far from the dipole MN (at least a distance equivalent to 3 times the largest size of the device and in a perpendicular sense thereto)
The depth of investigation depends on the type of device, the size of the device and the materials to be studied (size, arrangement, resistivity contrast, etc.). In general terms they are usually in the order of 40% of the maximum n *, in the Wenner and Schlumberger devices, and 30% of the maximum n * in the dipole-dipole.
Regarding the choice of one type of device or another, the following general rules can be followed:
- The Wenner device is the most sensitive to vertical changes
- The dipole-dipole and pole-dipole devices are the most sensitive to horizontal changes
- The Schlumberger device is a compromise between the above, goes quite well when horizontal and vertical changes are expected
A disadvantage of the dipole-dipole device is that when the spacing between the dipoles is somewhat large (medium or high depths of investigation), the signal is very weak and in many cases there is no reading since it must be started with A small a (values of δV and δI are very weak, even if state-of-the-art signal stacking equipment is used). In order to solve this problem, the value of a certain number of levels must be increased, with the consequent slowdown in the work, increase of the costs and, fundamentally, very significant increase of the external "perturbations-parasites" that make it unfeasible
This problem disappears using a pole-dipole device, but in this case the direct and inverse device must be used in order to correctly locate the detected anomalies. On the contrary it is necessary to take more measures and to extend the electrode of ∞
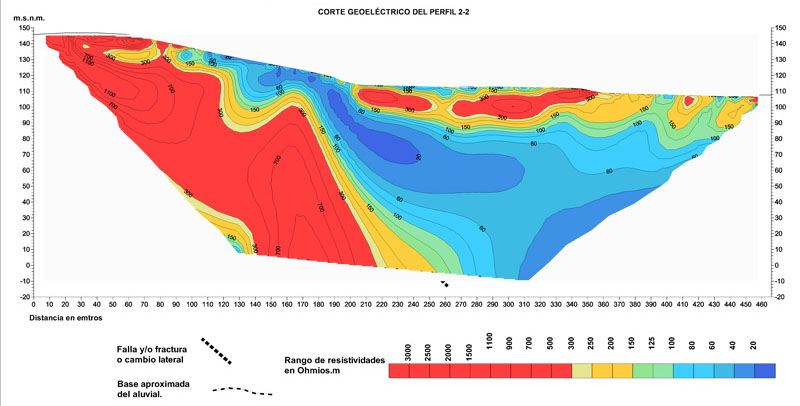
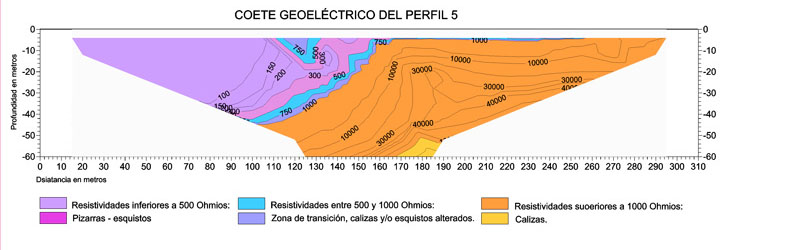
As regards vertical changes, that is, delimitation of pseudo-horizontal layers in terms of both their thickness and their resistivity, will only be achieved when the entire layer is within the range of depth achieved with the tomography. In order to define the depth of the ceiling and the resistivity of these "incomplete" layers, we have to resort to the support of the SEVs (in fact, the vertical changes in this sense are better defined by the SEVs). This case is illustrated in Figure 1 attached
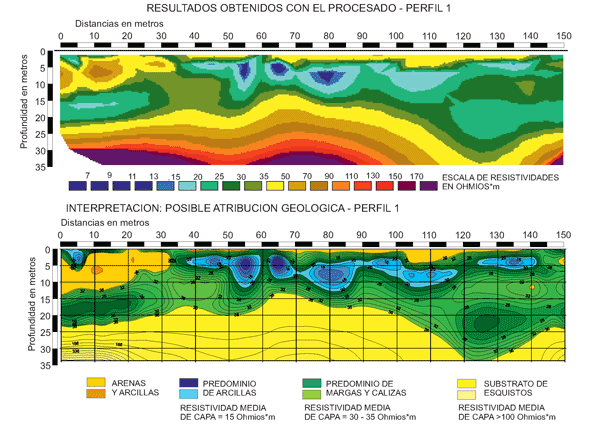
In this figure it can be observed that the layers of sand and clays, predominance of clays and predominance of marls and limestones, are perfectly defined, but not the substrate of schists. In the final part of the section there is a gradual increase of resistivity (similar to the ascending branch of a SEV) without being able to define where the layer starts and to which resistivity it tends; In the case shown this problem has been solved with the help of SEV that it is allowed to obtain the interpreted section that is presented (in this case the results have been checked with a near mechanical probe)
Electrical tomography applications
Like all types of electric pestles its usefulness is focused on the detection of lateral changes of electrical resistivity, which translates into the possibility of detecting dikes, faults and / or fractures (in both cases depending on its size and if there is contrast of Resistivity with their environment), buried bodies, cavities (in both cases depending on their size can be detected to a depth or another), areas of intrusion of pollutants, lateral contacts between geological formations with sufficient resistivity contrast, etc.
Resistivity data, provided by the electrical tomography technique, coupled with seismic data are able to provide detailed structural and geological information to assist in the planning of different civil engineering projects.
Electrical tomography can be quite effective in characterizing subsurface groundwater at contaminated sites method. The information obtained by electrical tomography can be used, for example, for a better assessment of possible distributions of contaminants or can help to plan the rehabilitation of the affected area.
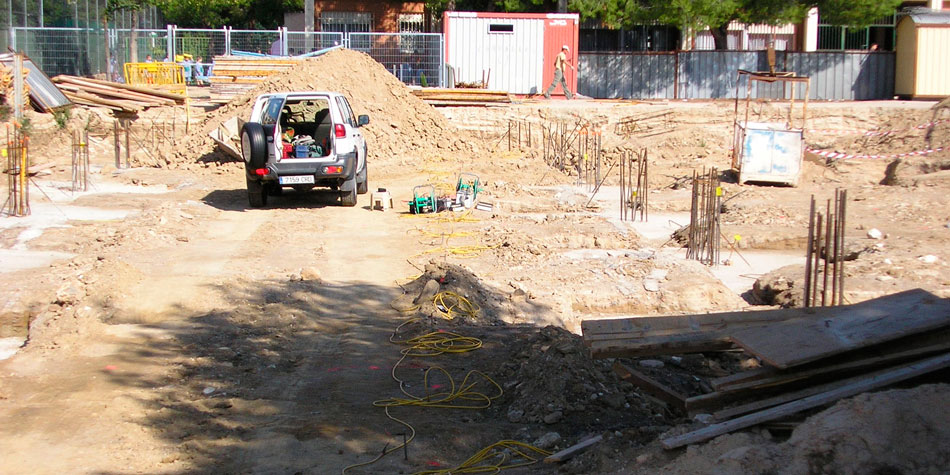
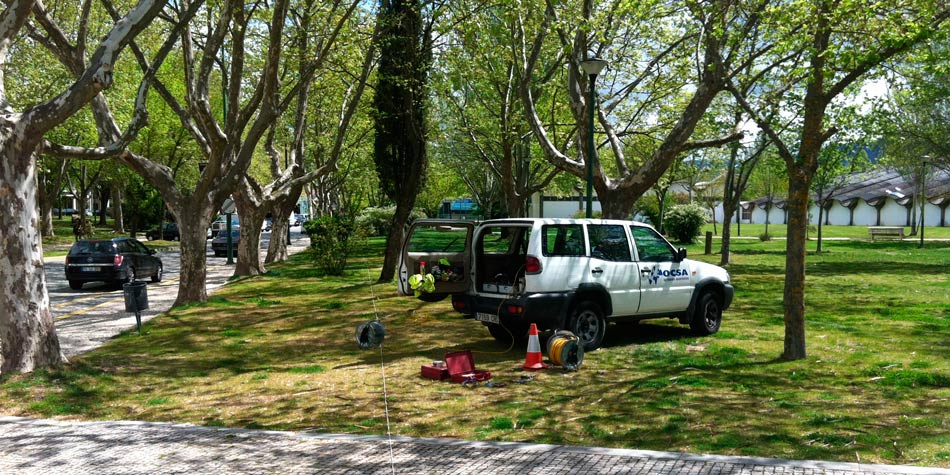
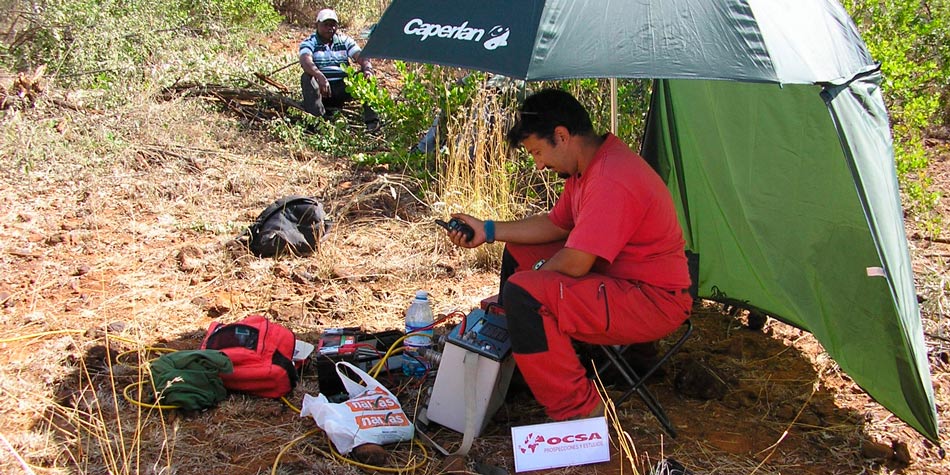
Examples of electrical tomography work
Geoelectric recognition for the detection of possible cavities
Limiting the boundaries of a quarry by electrical tomography
Electrical tomography project for the delimitation of aquifers
Geoelectric recognition for a dam